
- March 28, 2025
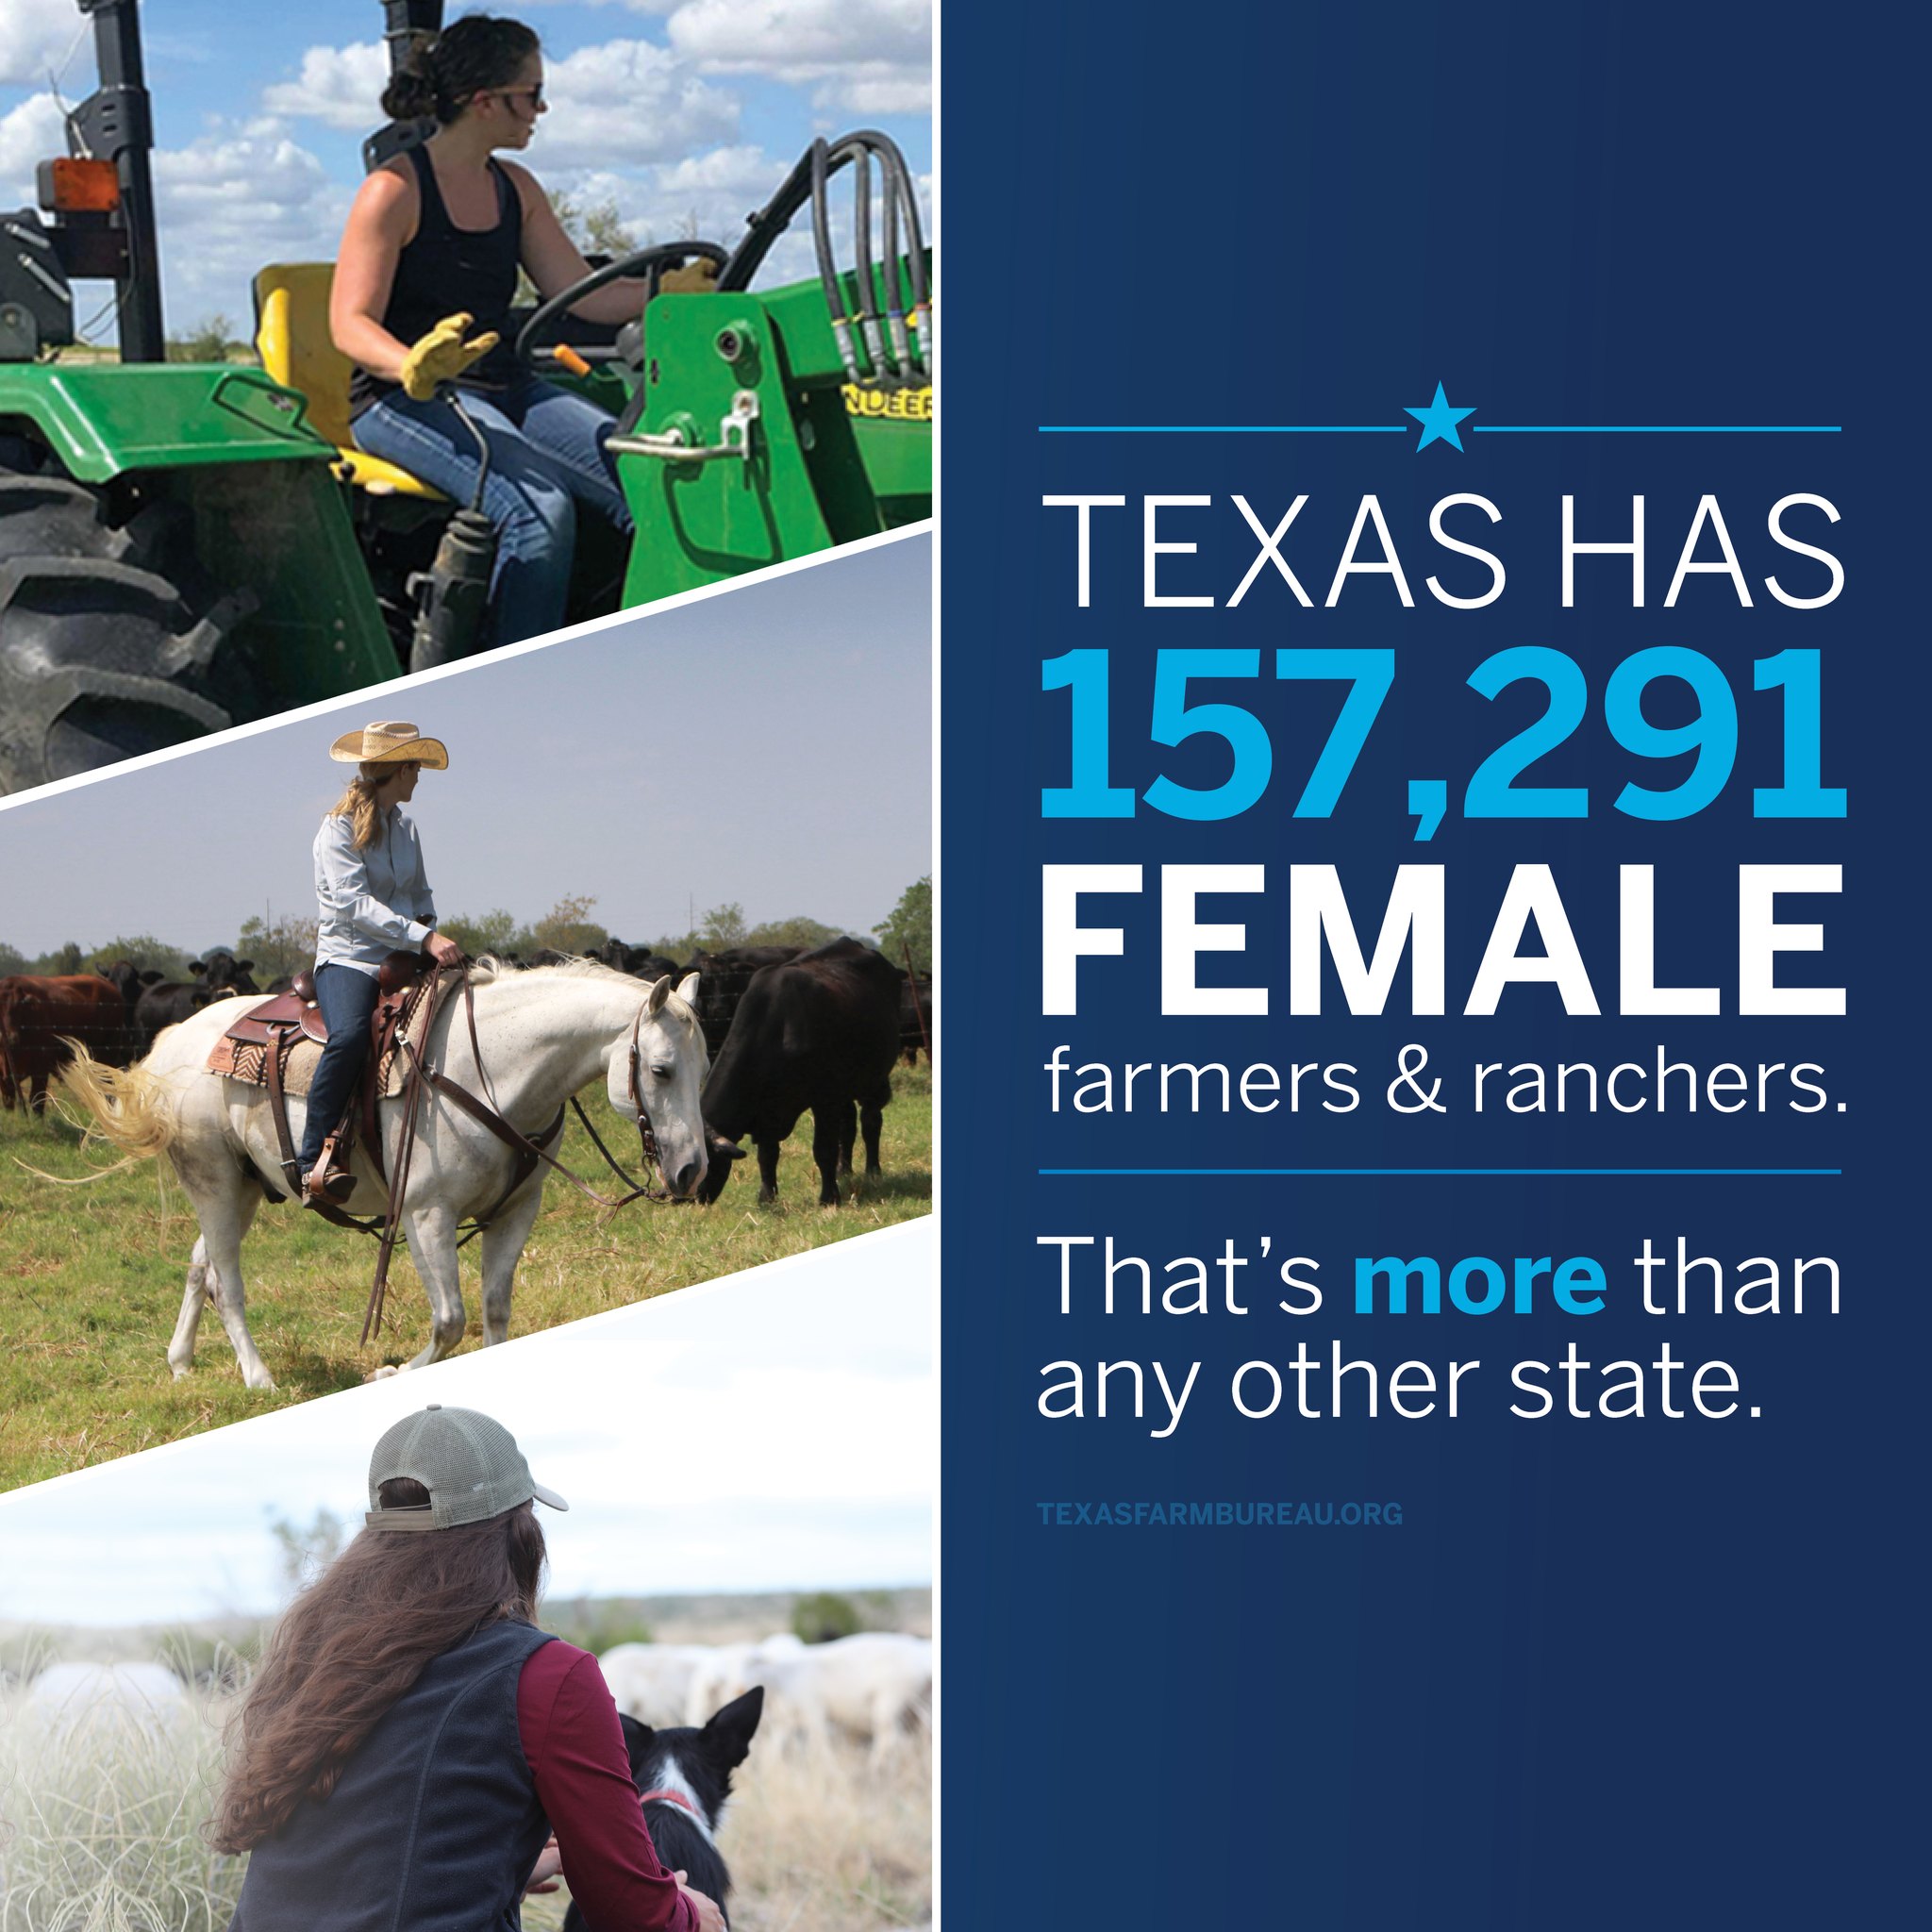
Women Make Up 39.0% of Farmers in Texas
A new study on behalf of Trace One has identified the U.S. states and counties with the highest representation of female farmers.
As Women’s History Month highlights the contributions of women across industries, a quiet transformation is unfolding in American agriculture. Female farmers are taking on a larger role in shaping the future of farming, contributing to both local economies and national food production.
Recent data from the U.S. Department of Agriculture reveals a steady rise in the number of women involved in farm decision-making and management. From small family farms to large commercial operations, women are increasingly present in agricultural leadership. As this shift continues, certain parts of the country stand out for having a higher concentration of female farmers.
This report, conducted by food and beverage software provider Trace One, examines where women are making the biggest impact in agriculture, analyzing the states with the highest share of female producers and female-operated farms.
The Growing Number of Female Farmers in the U.S.
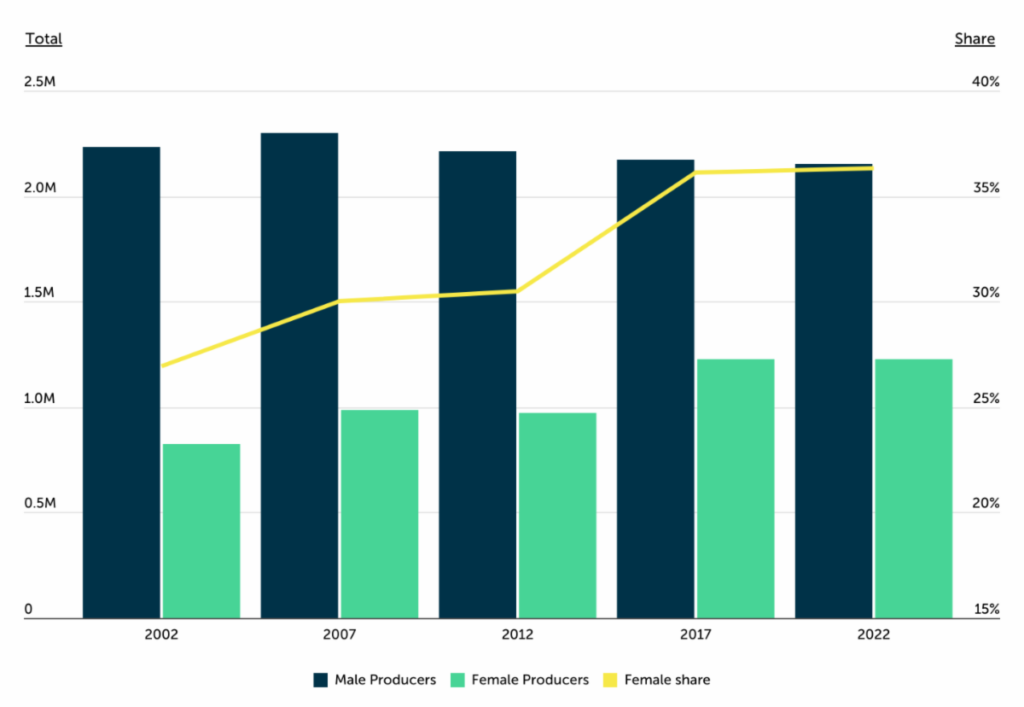
Over the past two decades, the share of female farmers in the United States has steadily increased. According to data from the most recent Census of Agriculture, women now make up more than a third of all agricultural producers, a notable rise from 26.9% in 2002.
A key turning point came with the 2017 Census of Agriculture, which expanded the definition of producers to provide a more comprehensive picture of the people involved in farm decision-making. As a result, the recorded number of female producers increased significantly from 969,672 in 2012 to 1,227,461 in 2017, in part due to this broader definition.
Despite this change in methodology, the data also shows a clear long-term trend: the number of male producers has been declining since 2007, when it peaked at 2.3 million. By 2022, that number had fallen to 2.15 million, continuing a downward trajectory. Meanwhile, the share of female producers has grown consistently across every Census—from 30.0% in 2007 to 30.5% in 2012, even before the definitional change in 2017 pushed it higher to 36.1%. The 2022 Census confirmed that this upward trend has continued, with women now accounting for 36.3% of all producers.
Female Farmers by Industry
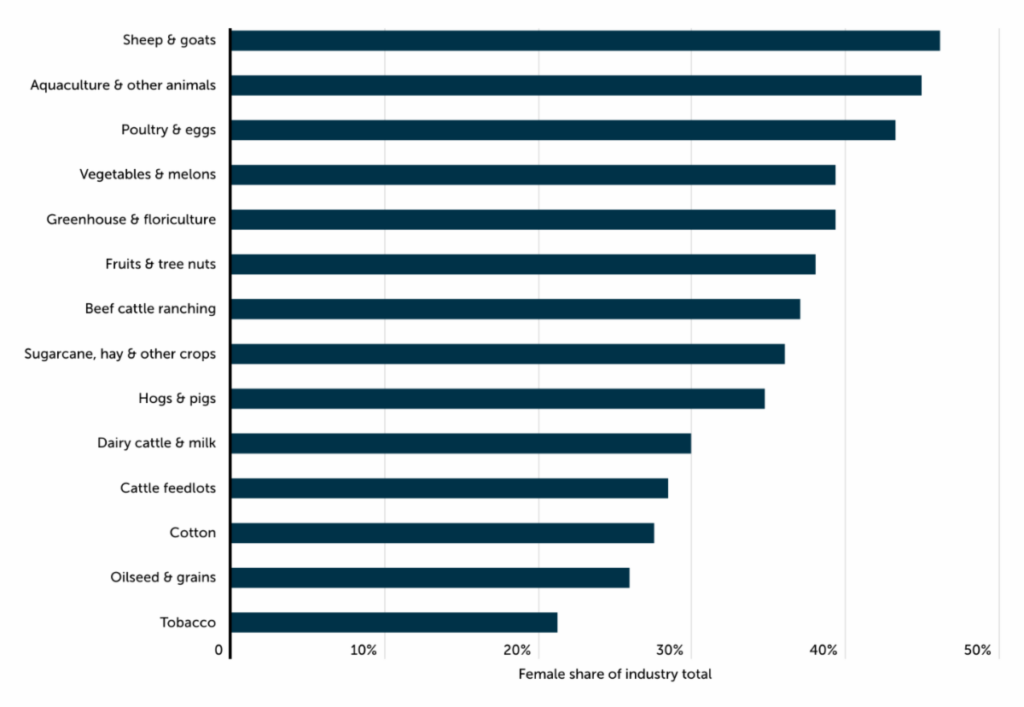
While there are a record number of female farmers in the U.S., their presence varies significantly across different farming industries. Female producers are most concentrated in livestock operations involving smaller animals, specialty crops, and greenhouse production, while they have lower representation in large-scale commodity farming.
Women have the highest representation in sheep and goat farming, where they make up 46.1% of all producers, followed closely by aquaculture and other animal production (44.9%). This category includes horse farming, which has historically had strong female participation. Poultry and egg farming also has a high share of female producers (43.2%). While large-scale poultry production is dominated by major agribusinesses, smaller-scale poultry operations—such as those focused on pasture-raised eggs, organic poultry, or specialty breeds—are also common.
Additionally, female producers are well represented in vegetable and melon farming (39.3%), greenhouse and floriculture production (39.3%), and fruit and tree nut farming (38.0%). These sectors frequently involve intensive management, diversified crop production, and specialty markets, which may attract more women.
In contrast, female representation is lower in commodity crop production and large-scale livestock operations. Women account for just 27.5% of cotton farmers, 25.9% of oilseed and grain producers, and only 21.2% of tobacco farmers—the lowest share among all major agricultural sectors. Similarly, industries that require large-scale infrastructure, such as cattle feedlots (28.4%) and dairy farming (29.9%), have lower female participation rates.
The Concentration of Female Farmers by State & County
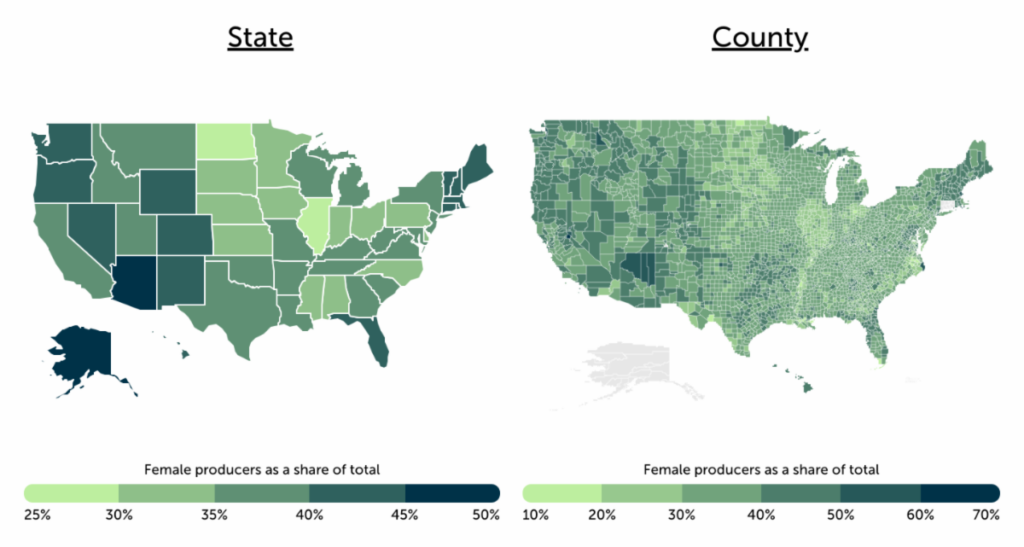
Female farmers are not evenly distributed across the country. The western United States and the Northeast have the highest concentrations of female producers, while much of the Midwest and parts of the Southeast have the lowest.
Arizona leads the nation, with 47.9% of its agricultural producers being women. Other western states also rank high, including Alaska (47.6%), Oregon (44.0%), and Nevada (42.7%). In the Northeast, states such as New Hampshire (44.8%), Maine (43.1%), and Rhode Island (42.9%) also have a high share of female producers. These regions tend to have a greater proportion of smaller farms, direct-to-consumer markets, and diversified operations, which may offer more opportunities for women.
In contrast, the Midwest has the lowest share of female farmers, with the bottom five states being Illinois (28.0%), North Dakota (29.9%), Minnesota (31.0%), South Dakota (31.2%), and Iowa (32.7%). The Southeast also has relatively lower concentrations, with North Carolina (33.3%), Mississippi (34.4%), Alabama (34.7%), and several other southern states ranking below the national average. These regions are home to large-scale commodity crop operations—such as corn, soybeans, and commercial livestock—which historically have had lower female representation.
County-level data reinforces these trends. Among the nation’s largest agricultural counties, Coconino County, AZ (52.9%) has the highest share among large counties, followed closely by Apache County, AZ (52.6%) and Navajo County, AZ (51.0%). These counties include tribal lands, where women often play a significant role in agriculture, and also contain some of the highest concentrations of small farms in the country. Other counties with a high proportion of female farmers include Pierce County, WA (49.5%); Deschutes County, OR (49.2%); and McKinley County, NM (49.1%), reinforcing the regional trend of stronger female representation in the West.
Here is a summary of the data for Texas:
- Female producers as a share of total: 39.0%
- Female-operated farms as a share of total: 62.2%
- 10-year change in female producers: +30.3%
- 10-year change in female-operated farms: +25.1%
- Total female producers: 157,291
- Total female-operated farms: 143,585
- Total producers: 402,876
- Total farms: 230,662
For reference, here are the statistics for the entire United States:
- Female producers as a share of total: 36.3%
- Female-operated farms as a share of total: 58.4%
- 10-year change in female producers: +26.3%
- 10-year change in female-operated farms: +20.2%
- Total female producers: 1,224,726
- Total female-operated farms: 1,110,546
- Total producers: 3,374,044
- Total farms: 1,900,487
Methodology
The data in this study was sourced from the U.S. Department of Agriculture’s (USDA) Census of Agriculture, specifically the most recent 2022 edition, which was released in 2024. Researchers at Trace One analyzed the data to determine the states and counties with the highest representation of female farmers. This was measured in two ways: the proportion of total agricultural producers who are women and the percentage of farms classified as female-operated. According to the USDA, a producer is defined as any individual actively involved in making decisions for a farming operation. A female-operated farm, meanwhile, is one in which at least one producer is a woman.
The analysis includes national-level data, all 50 states, and counties with available information. However, due to missing data or modifications in geographic definitions, counties in Alaska and Connecticut were excluded from the county-level findings. To allow for meaningful comparisons, counties were categorized based on their number of agricultural producers: small (fewer than 1,000 producers), midsize (1,000 to 2,500 producers), and large (more than 2,500 producers).
NOTES TO EDITORS
About Trace One
Trace One is a global leader with over 30 years of experience specializing in regulatory compliance and PLM solutions for the food and beverage industry. Its work has been featured in Newsweek, MSN, USA Today, ABC, and more. Additional commentary and insights can be provided on request.
Author
Federico Fontanella, Trace One
Graphics
Hi-res charts and graphics from the report can be found here.
Media Contact
Michael LaFirenza mike@latticenewswire.com